Analysis EUR/USD 5M
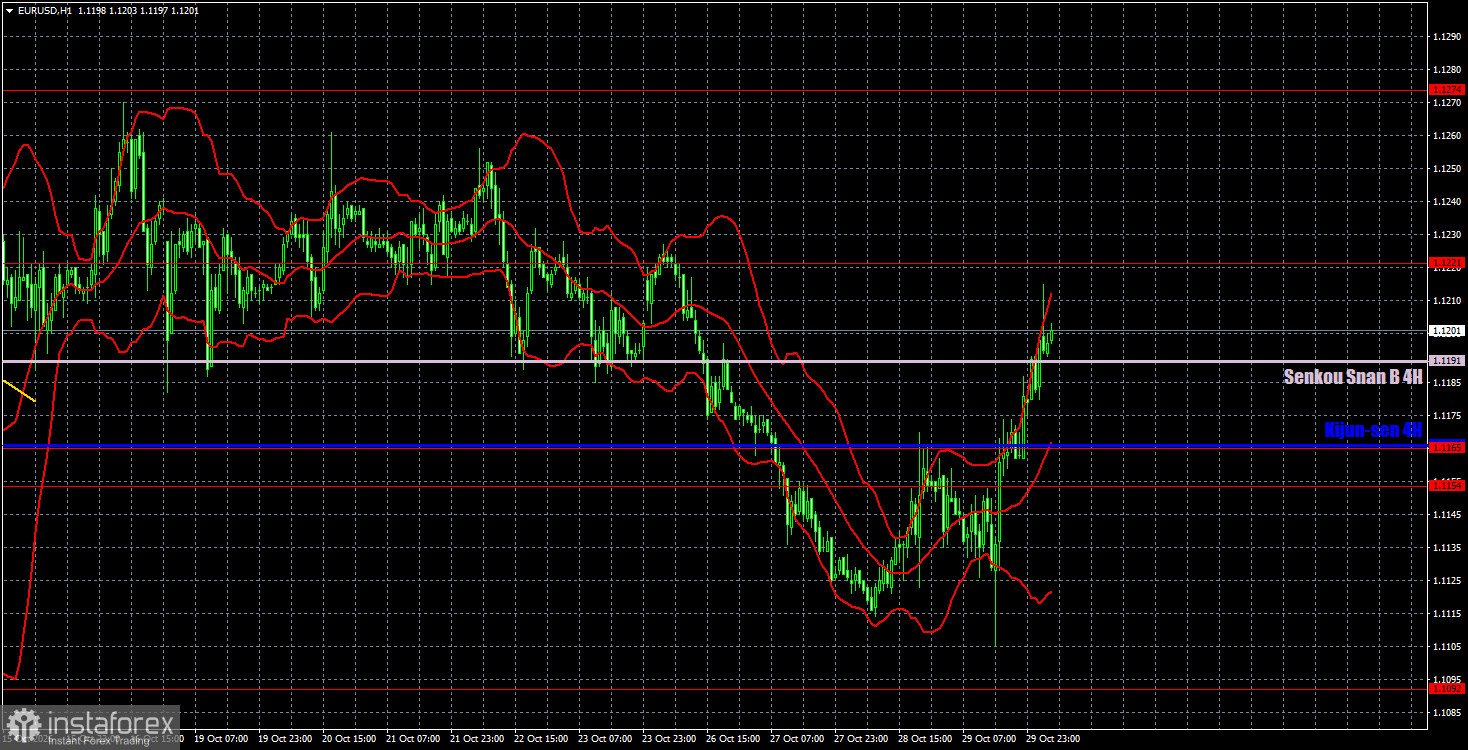
The EUR/USD pair unexpectedly rose sharply on Thursday—something it hadn't managed in about two months. Yesterday the European Central Bank met and made no major policy changes. The single notable announcement was Christine Lagarde's decision to step down as ECB president in February next year. In the U.S., the Q3 GDP report beat forecasts at 3.4%, and core PCE — the Federal Reserve's preferred inflation gauge — rose to 3.1%. Those U.S. data clearly supported the dollar. Yet the market, which had been buying the dollar for the past two months on any pretext, suddenly stopped adding new long positions. Thus, yesterday's euro advance could mark the start of a new uptrend, logical and consistent given the combination of factors. Recall that the weekly timeframe still shows the long-term uptrend from 2022, and the dollar's strength in 2026 has largely been a correction — a correction that would not have occurred without the Middle East war.
Technically, the downtrend may be over, since the trend line has been broken. If price convincingly clears the Senkou Span B line, that would significantly improve the bulls' prospects and the euro's outlook. We fully support further gains in the single currency.
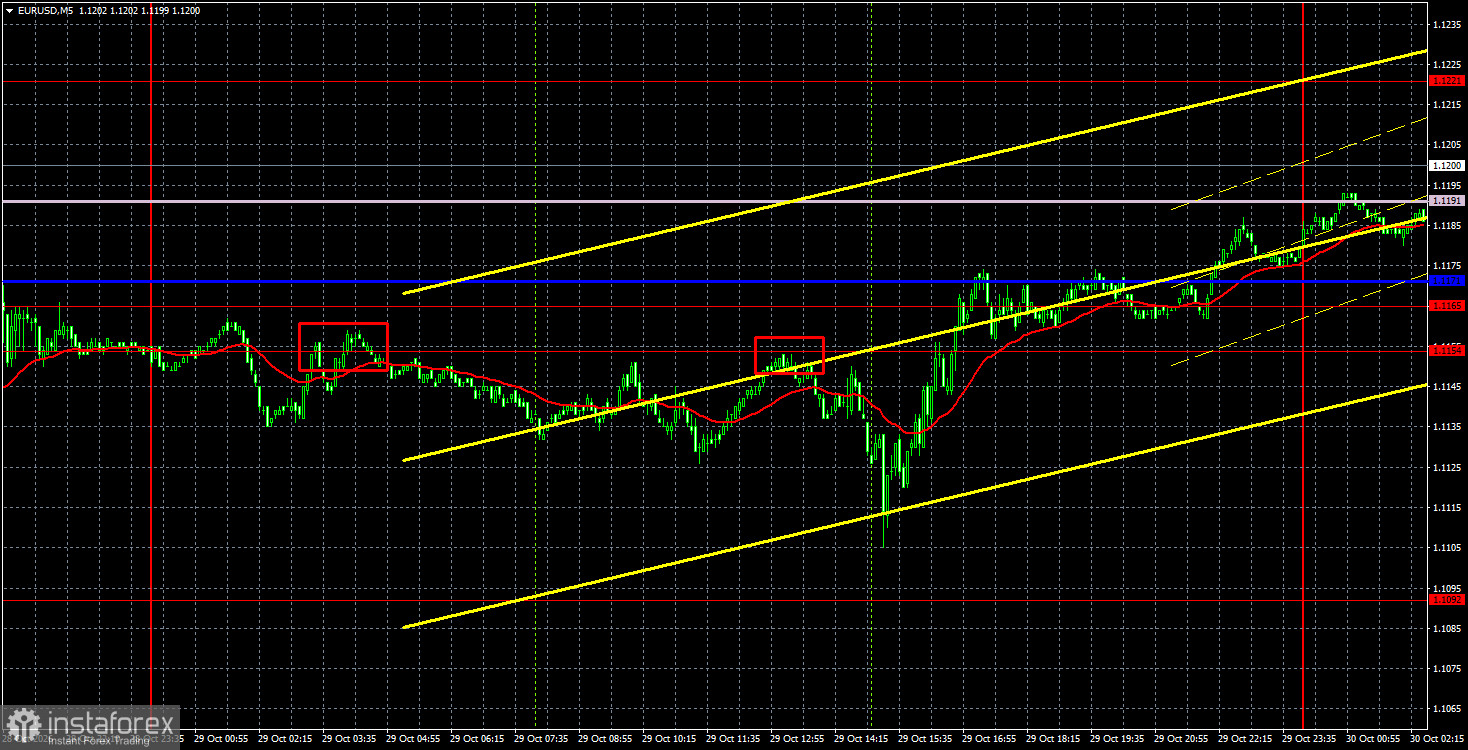
On the 5-minute timeframe, two sell signals formed on Thursday as bounces from the 1.1154–1.1165 area. We also saw intraday declines, so those short positions were not unprofitable. Talks of buying the euro become meaningful only after Ichimoku lines are overcome.
COT report
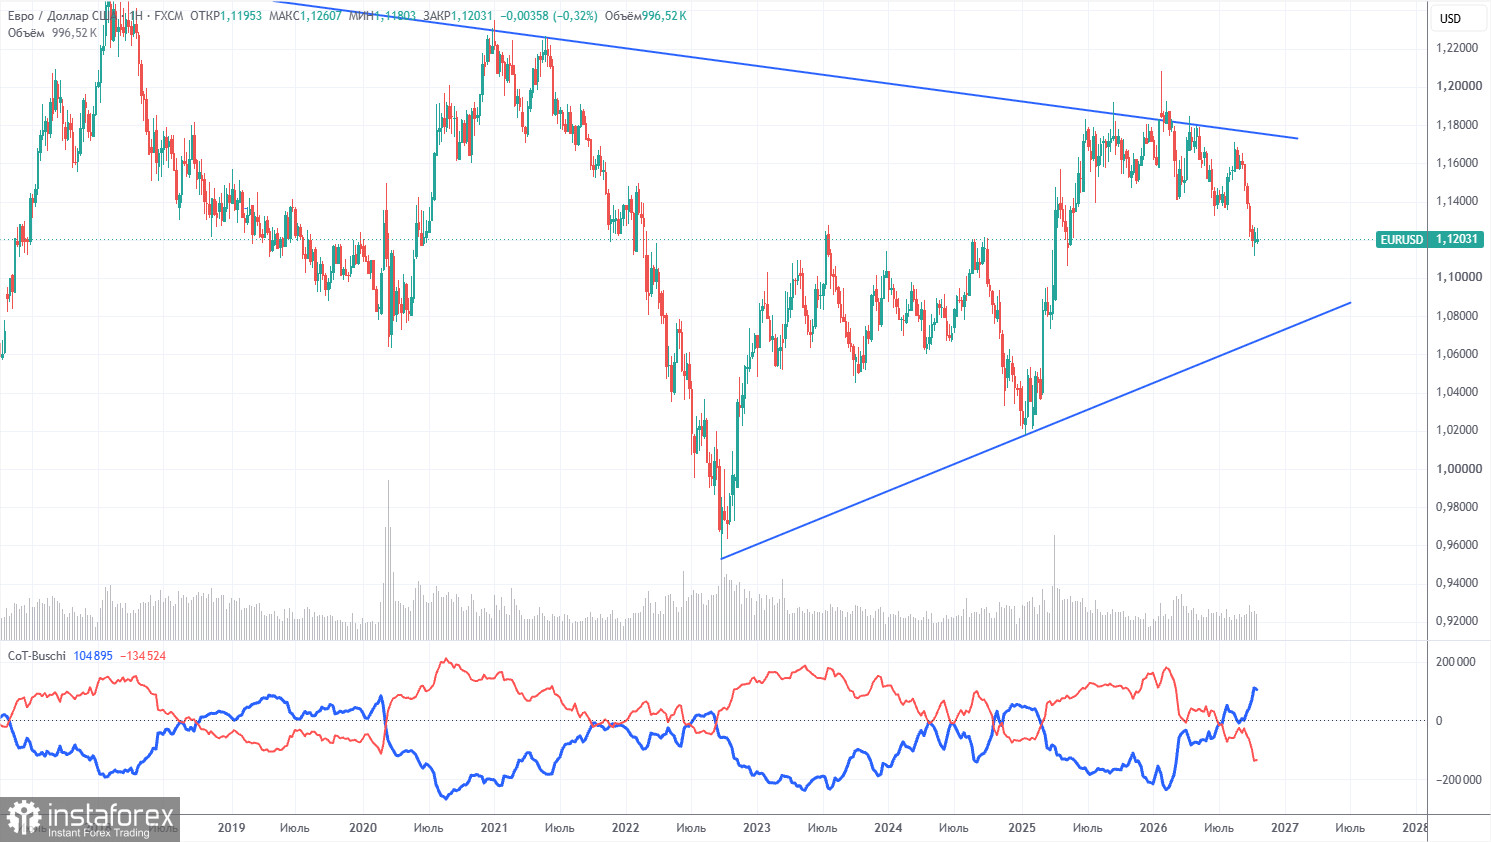
The latest COT report is dated October 20. On the weekly TF, non-commercial traders' net position remains clearly bearish and has declined significantly in 2026 due to geopolitical events. Over the past eight months, traders have been exiting the euro in favor of the U.S. dollar. Donald Trump's policies have not changed, but the dollar served as a reserve currency for a time.
However, we still do not see any fundamental factors that would further strengthen the U.S. dollar. The war in the Middle East made the dollar super-attractive for a while, and the Fed's monetary-policy stance surprised the dollar for the second time this year. In the long term, the euro could fall as low as $1.08 (the trend line), but the longer-term uptrend will remain relevant. Nevertheless, in recent weeks the market has priced in only positive factors for the dollar and ignored everything else.
The arrangement of the red and blue indicator lines points to the bears' advantage. During the last reporting week, long positions among the "Non-commercial" group rose by 3,500, while short positions increased by 500. Accordingly, the net position rose by 3,000 contracts over the week.
Analysis EUR/USD 1H
On the hourly timeframe, the EUR/USD pair finally has the opportunity to form an uptrend. On the daily and weekly timeframes, the chances of a strong, lasting trend remain high. However, for the euro to rise it must be bought. Over the past two weeks and two months, the market has shown little willingness to buy the euro. Therefore, based on market sentiment, we would say a new decline is more likely. Nevertheless, a rise in the pair would be much more logical and consistent.
For October 30 we highlight the following levels for trading — 1.1006, 1.1115, 1.1154–1.1165, 1.1221, 1.1274, 1.1362–1.1368, 1.1461–1.1473, 1.1536–1.1542, 1.1585, 1.1657–1.1665, as well as the Senkou Span B line (1.1191) and the Kijun-sen (1.1166). Ichimoku lines may shift during the day, so account for this when determining trading signals. Remember to move your Stop Loss to breakeven after the price moves 15 pips in the right direction; this will protect against possible losses if the signal proves false.
On Friday, the euro area and Germany will publish inflation, unemployment, and GDP reports. No strong single reaction is expected, but we may see some market moves. Regardless of the exact nature of the macro data, we expect the euro to rise.
Summary of the above analysis:
Traders can consider targets for short positions near 1.1115 if price fails to decisively clear the Senkou Span B line. If price holds above Senkou Span B, consider long targets at 1.1221 and 1.1274.
Explanations for the illustrations:
- Price support and resistance levels (resistance/support) — thick red lines around which movement may end. They are not sources of trading signals.
- Kijun-sen and Senkou Span B lines — Ichimoku indicator lines transferred to the hourly timeframe from the 4-hour timeframe. They are strong lines.
- Extreme levels — thin red lines from which the price previously bounced. They are sources of trading signals.
- Yellow lines — trendlines, trend channels, and any other technical patterns.
- Indicator 1 on the COT charts — the size of the net position of each trader category.