
Vea también


 11.11.2026 05:11 PM
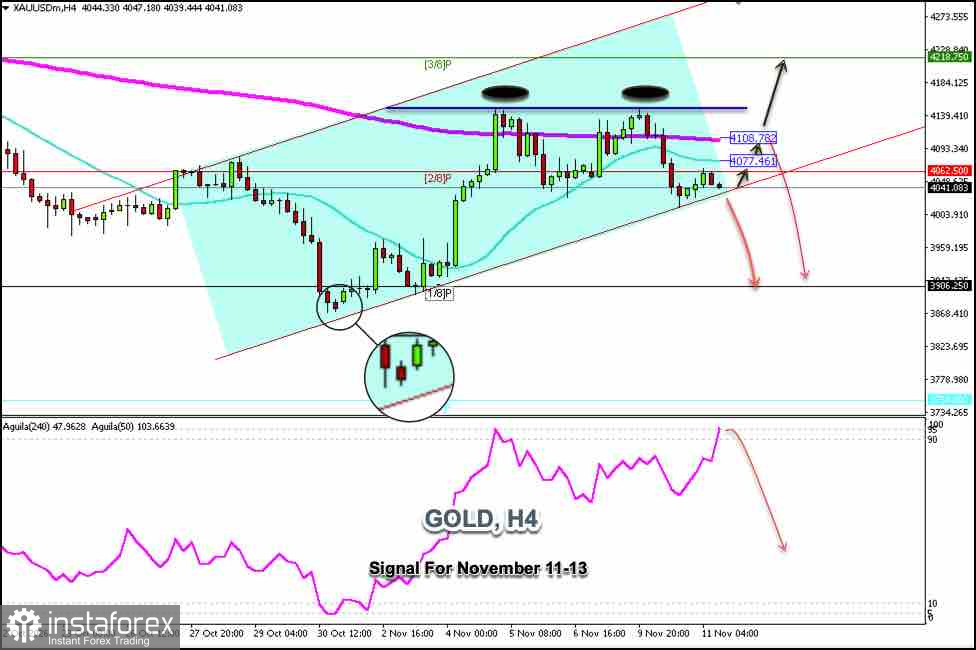
The price of gold has managed to remain around $4,041 within the uptrend channel formed since October 30 and is showing signs of being overbought; as we can see on the H4 chart, the price is under downward pressure.
Since the price reached the $4,139 area, it has been unable to break above this level, having formed a double top pattern on two occasions; as a result, the price is now consolidating below the 2/8 Murray line and below the two moving averages—the 21-period simple moving average (SMA) and the 200-period exponential moving average (EMA)—which means the outlook remains negative for the coming days.
If gold consolidates above $4,108 and above the 200-period exponential moving average (EMA) in the coming hours, we could look for buying opportunities with targets at the Murray 3/8 level, around $4,218, as this could support an upward rally; we might even expect it to reach the upper band of the uptrend channel, around $4,290.
If a pullback occurs toward $4,108 and the price fails to consolidate above the 200-period exponential moving average (EMA), this could be considered a negative signal for opening short positions.
If gold breaks decisively below the downtrend channel and consolidates below the 1/8 Murray level and below $4,040, the outlook could remain under downward pressure, and we could expect it to reach the 1/8 Murray level around $3,906 and ultimately fill the gap left on October 30 around $3,873.
The Eagle indicator has reached overbought levels; therefore, any technical rebound—as long as the instrument trades below $4,140—will be considered a selling opportunity in the coming days.
You have already liked this post today
*El análisis de mercado publicado aquí tiene la finalidad de incrementar su conocimiento, más no darle instrucciones para realizar una operación.


